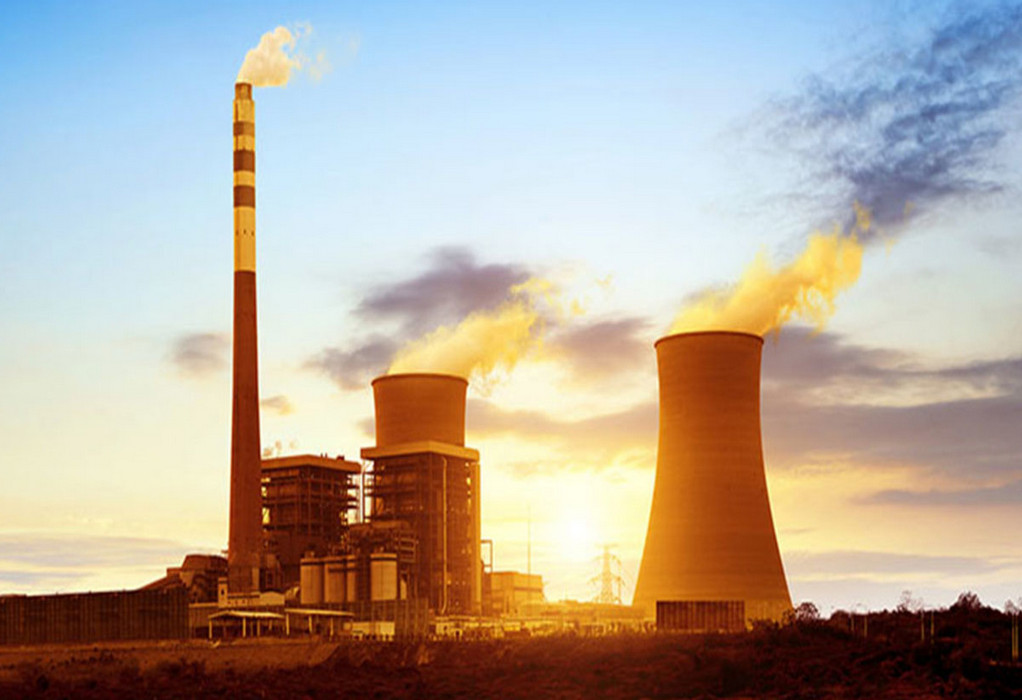
The global electricity mix remains dominated by fossil fuels; coal, as well as oil and gas, account for some 60%. Yet the world is on track to reach or surpass the record total nuclear power generation (measured in terawatt-hours) previously reached in 2021 when 2,762 TWh of nuclear energy was generated worldwide.
Last year, 2,686 TWh was generated, up from 2,639 TWh in 2022. For comparison, in 2010 – a year before the Fukushima disaster in Japan in 2011 – there was 2,725 TWh of nuclear power generation globally. In 1970 it sat at just 79 TWh.
The national conversation about energy has gone nuclear as debate rages about how Australia can transition away from coal-fired power stations and towards decarbonisation.
Currently in Australia, nuclear power generation is prohibited federally.
Nuclear may not be a dirty word to some, whereas coal still is, however coal is an important ingredient in steelmaking, and in 2020–21 Australia was the world’s largest exporter of metallurgical coal and the second largest exporter of thermal coal.
While the issue is polarising, Our World in Data lays out some bare facts about the dangers of each source of energy. It says that fossil fuels and biomass kill more people than nuclear and modern renewables per unit of electricity with coal “by far, the dirtiest”.
Assessing how each source of energy stacks up in terms of total deaths and short-term health risks, the data publication does note that fossil fuels still dominate the global electricity mix. As such, it’s expected the sector would kill more people.
Instead, a comparison is made based on the estimated number of deaths each source cause ‘per unit of electricity’ – measured in terawatt-hours. One terawatt-hour is about the same as the annual electricity consumption of 150,000 citizens in the European Union, according to Our World in Data. This includes deaths from air pollution and accidents in the supply chain.
The estimates for fossil fuels are likely to be very conservative. They are based on power plants in Europe, which the publication notes have sound pollution controls, and older models of the detrimental health effects of air pollution.
The online scientific data publication states that most people’s perceptions of the safety (or lack thereof) of nuclear energy are strongly influenced by two incidents – Chernobyl in Ukraine in 1986 and Fukushima in Japan in 2011.
To calculate the death rates used in those incidents, a death toll of 433 from Chernobyl and 2,314 from Fukushima directly were assumed. However, the official total for the number confirmed dead or listed as missing from the 2011 disaster from the tsunami in Japan is about 18,500.
However, it’s noted that the other energy source heavily influenced by a large-scale incident is actually hydropower. Since 1965 hydropower’s death rate is 1.3 deaths per TWh – almost completely dominated by one event – the Banqiao Dam Failure in China in 1975, with estimates of the death toll reportedly more than 150,000.
Had that not occurred, hydropower’s death rate would be just 0.04 deaths per TWh — comparable to nuclear, solar, and wind, in Data reports.
The death rates from both solar and wind are low but not zero. A small number of people have died along the supply chains, which range from helicopter collisions with turbines, to fires during the installation of turbines or panels, and drownings on offshore wind sites.
Nuclear energy, for example, results in 99.9% fewer deaths than brown coal, 99.8% fewer than coal, 99.7% fewer than oil, and 97.6% fewer than gas. Wind and solar are just as safe.
Nuclear power generation has existed since the 1960s, but the sector experienced massive growth globally in the 1970s, 1980s, and 1990s. In just 20 years, nuclear power generation rocketed from just 79 TWh in 1970 to 2,000 TWh in 1990.
In Australia, black coal is produced in Queensland, New South Wales, Western Australia, South Australia, and Tasmania, with the majority exported to overseas markets. According to the Department of Industry, Science and Resources, at the end of 2021, export earnings from black coal totalled $63.51 billion, up from $43.37 billion at the end of 2020. Japan and other Asian countries are prime destinations for Australian coal.
In 2021, coal exploration expenditure was $226.2 million, a decrease of 22.4% on 2020 ($291.6 million). Much of the expenditure occurred in Queensland, and coal exploration was some 6% of the 2021 total exploration spend, as per the Australian Bureau of Statistics (2023).
Australia in 2021 also held 14% of the world’s coal reserves (black and brown), ranking third behind the US (23%) and Russia (15%). Australia is thought to hold about 10% of world economic resources of black coal and ranks fourth behind the US (29%), China (18%), and India (14%). For brown coal, the country’s share of the world’s economic resources is 23%, ranking Australia second in the world behind Russia (28%).
Australia also accounted for nearly 6% of coal production (black and brown), ranking fifth behind China, India, Indonesia, and the US.
Tags: coal, Nuclear, Power


Recent Posts
Himachal Pradesh Plans Major Boost to Public Transport with E-Buses and Digital Upgrades
Ammonia-Fueled Container Feeder Design Marks Progress in Maritime Decarbonisation
ABS Develops Industry-Leading EV Battery Fire Simulation Modeling
Wilhelmsen Ships Service Joins the Maritime Battery Forum to Accelerate Maritime Electrification
Indian Student Team Wins Communication Prize at Monaco Energy Boat Challenge 2025
Babcock’s LGE Business Secures Contract for Marine Ammonia Fuel System to Advance Shipping Decarbonisation
Associated Terminals Deploys Liebherr’s All-Electric Cranes in Landmark Move Toward Cleaner Cargo Handling
Sanmar delivers fully electric emissions-free tug to major global operator Svitzer